PRISM
A production-shaped LLM gateway: multi-provider routing with automatic failover, PII/prompt-injection guardrails, exact caching, cost tracking, and full observability — built solo, benchmarked with real numbers.
Ungoverned LLM access breaks the same five ways
Every team that scales past "call OpenAI directly from the app" runs into the same five problems at once: unpredictable cost, no visibility into failures, security exposure (PII leakage, prompt injection), no resilience when a provider degrades, and no way to swap models without touching application code. Commercial products in this exact category — LiteLLM, Portkey, Helicone, Kong AI Gateway — are venture-funded because the problem is real. Prism is a real, working version of that same idea, with the tradeoffs made explicit rather than hidden.
Two views of the system
Every call to /v1/chat/completions passes through the same pipeline. Two paths exit early — a guardrail block and an exact-cache hit — both skipping the provider call (and its cost) entirely.
flowchart TD
    Client(["Client (openai SDK, base_url=prism)"]) -->|"POST /v1/chat/completions"| Auth
    Auth["Auth: hash key + Redis rate limit"] -->|invalid key| Reject401(["401 Unauthorized"])
    Auth -->|over limit| Reject429(["429 Rate Limited"])
    Auth -->|ok| Guardrail
    Guardrail["Guardrail pre-check: PII + injection scan"] -->|flagged| Block(["400 Blocked"])
    Guardrail -->|clean| CacheLookup
    CacheLookup{"Exact cache hit?"}
    CacheLookup -->|yes| CacheHit(["200: cache_hit=true, cost=$0"])
    CacheLookup -->|no| Router
    Router["Router: fallback chain + circuit breaker"] --> Provider
    Provider["Provider call: Ollama / OpenAI-mock / Anthropic-mock"]
    Provider -->|success| CostLog
    Provider -->|failure, try next| Router
    Provider -->|all exhausted| Reject503(["503 All providers failed"])
    CostLog["Cost calc + log request"] --> CacheWrite
    CacheWrite["Cache write"] --> Response(["200 + prism_metadata"])
FIG. 1 — Request flow through the gateway pipeline
graph LR
    subgraph host["Host machine"]
        Ollama["Ollama: llama3.2:3b"]
    end
    subgraph compose["docker-compose"]
        App["app: FastAPI / Prism"]
        Postgres[("postgres + pgvector")]
        Redis[("redis")]
        Jaeger["jaeger: trace UI"]
        Prometheus["prometheus: metrics scrape"]
        Grafana["grafana: dashboards"]
    end
    App -->|SQL| Postgres
    App -->|cache + rate limit| Redis
    App -->|OTLP spans| Jaeger
    App -.->|chat + embeddings| Ollama
    Prometheus -->|scrape| App
    Grafana -->|query| Prometheus
FIG. 2 — Infrastructure topology (Ollama runs on the host, not containerized)
The admin dashboard and observability stack
A four-tab admin dashboard (/admin/dashboard) — Overview, Cost & Teams, Performance, Safety — built with hand-rolled vanilla JS and inline SVG charts, no chart library, no build step. Alongside it, a Grafana operational dashboard fed by Prometheus and OpenTelemetry.
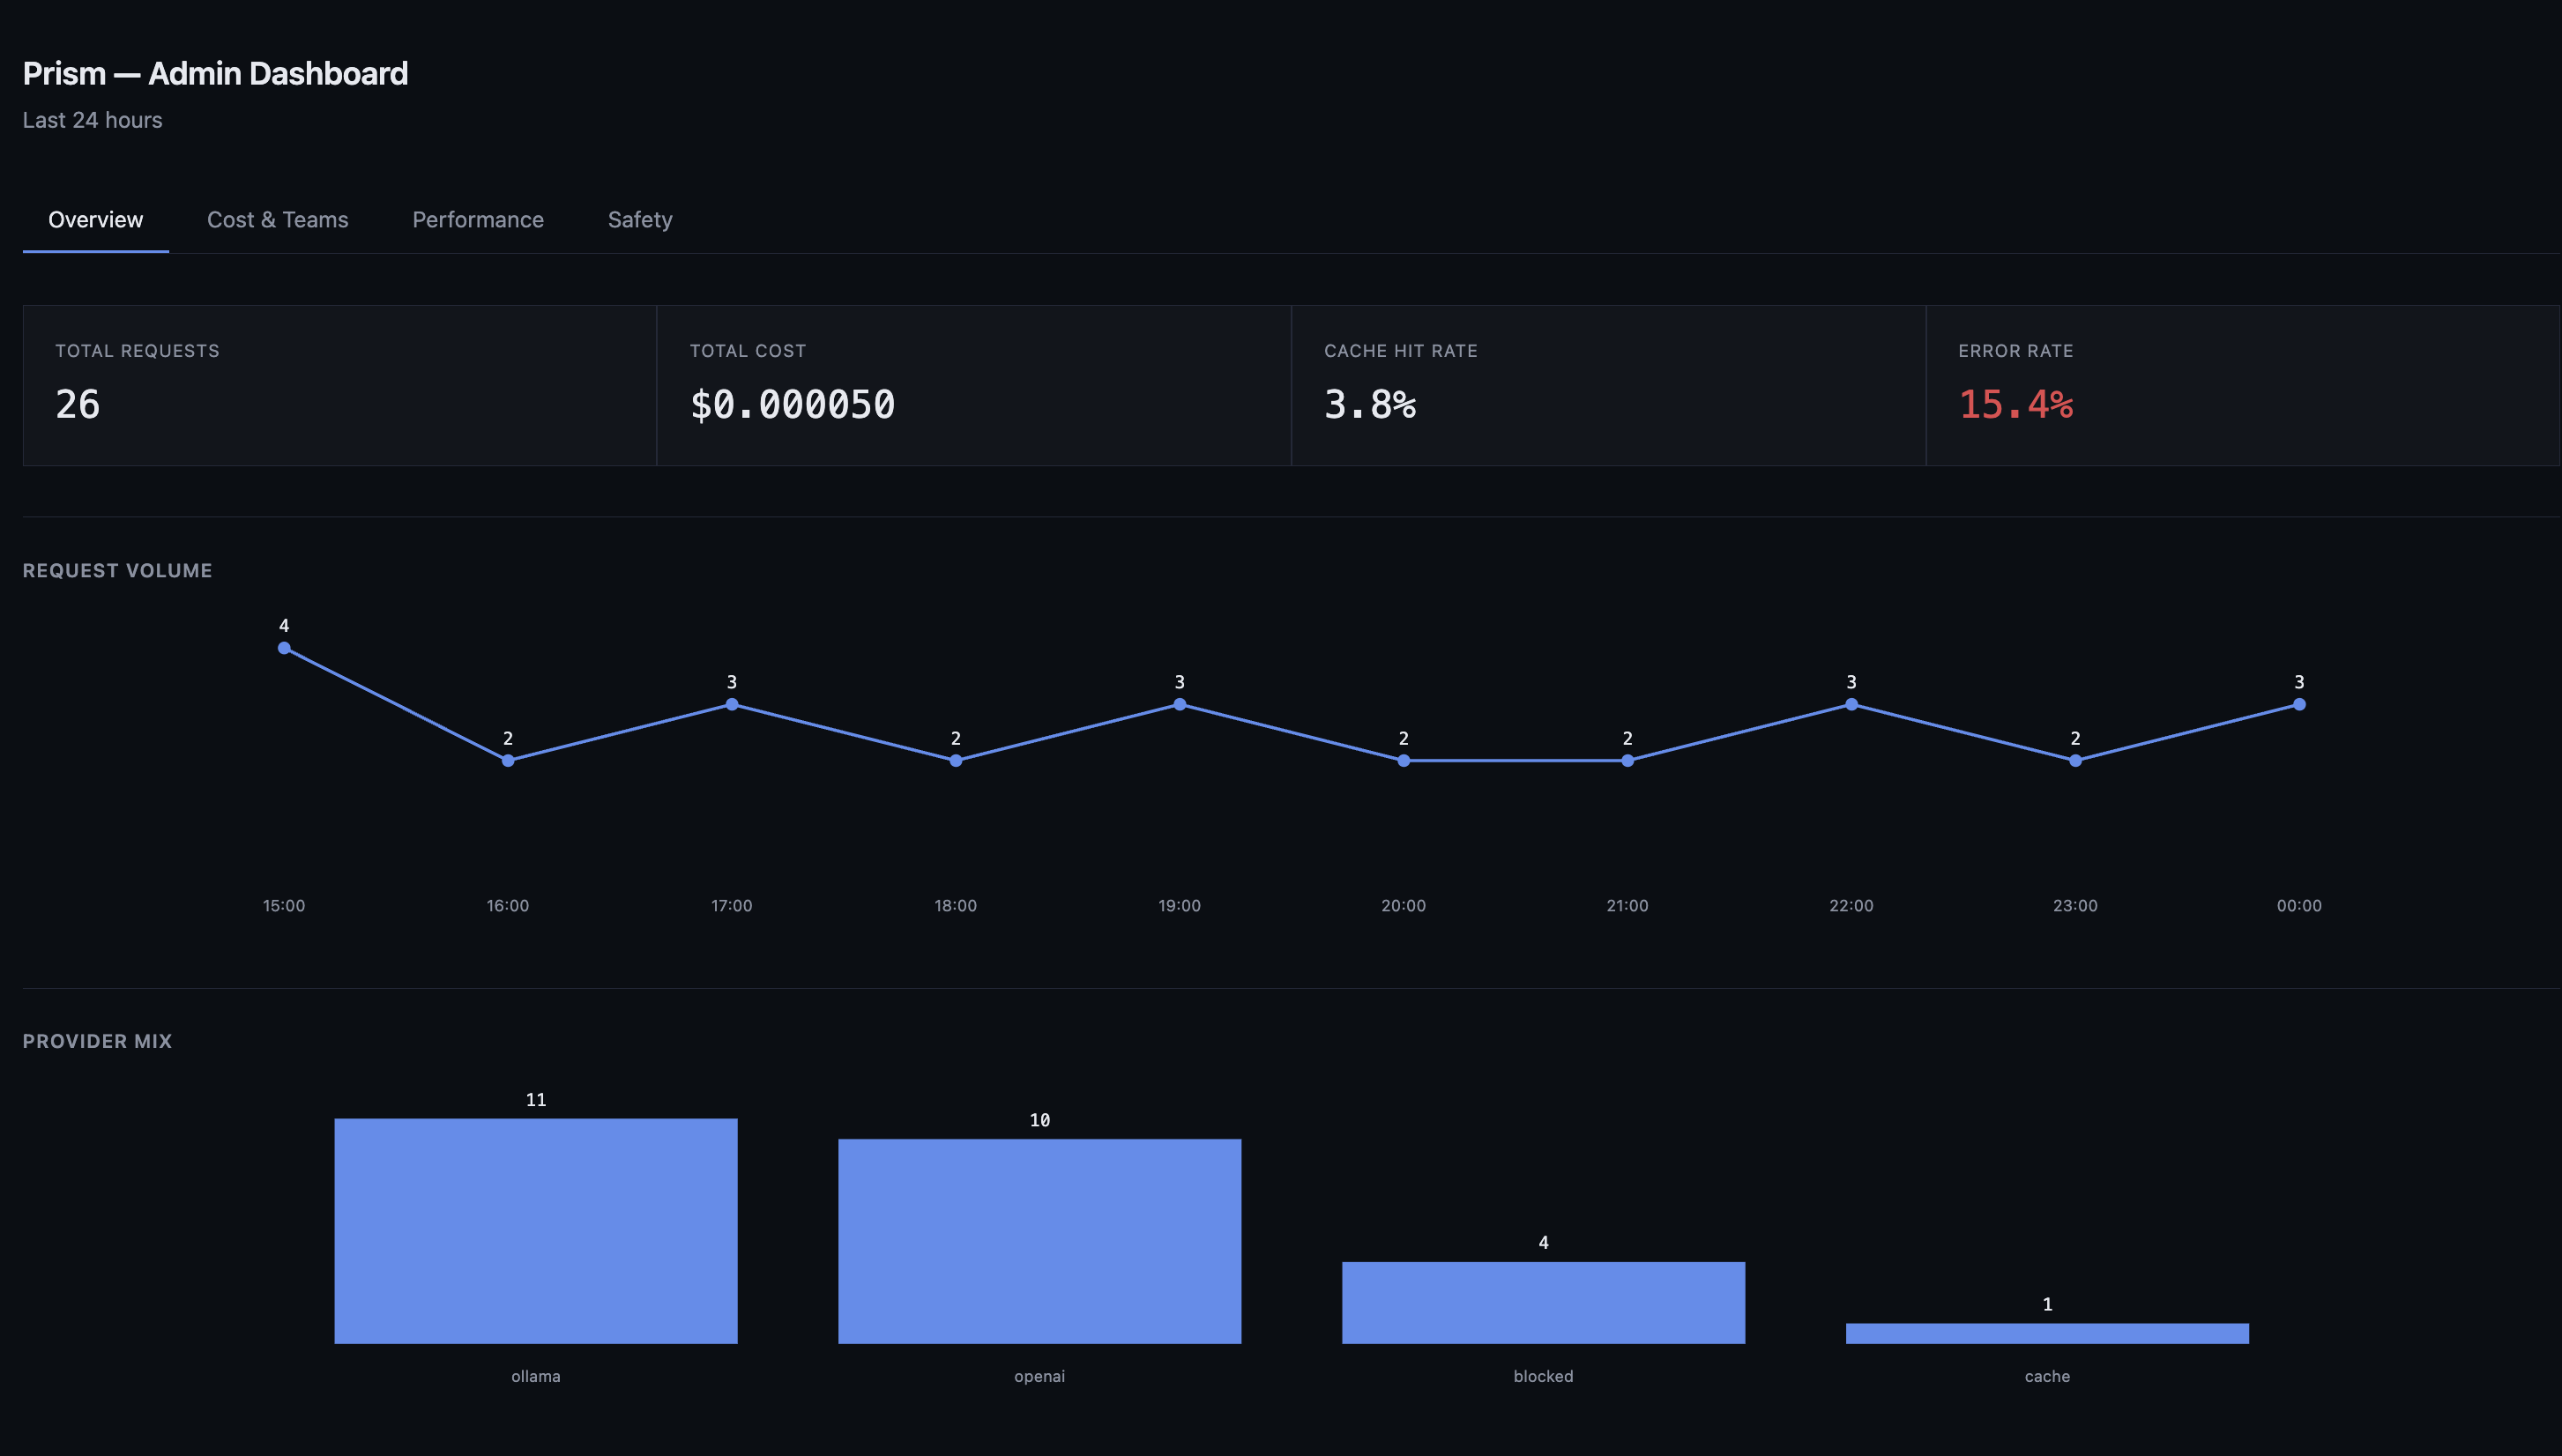
FIG. 3 — Overview
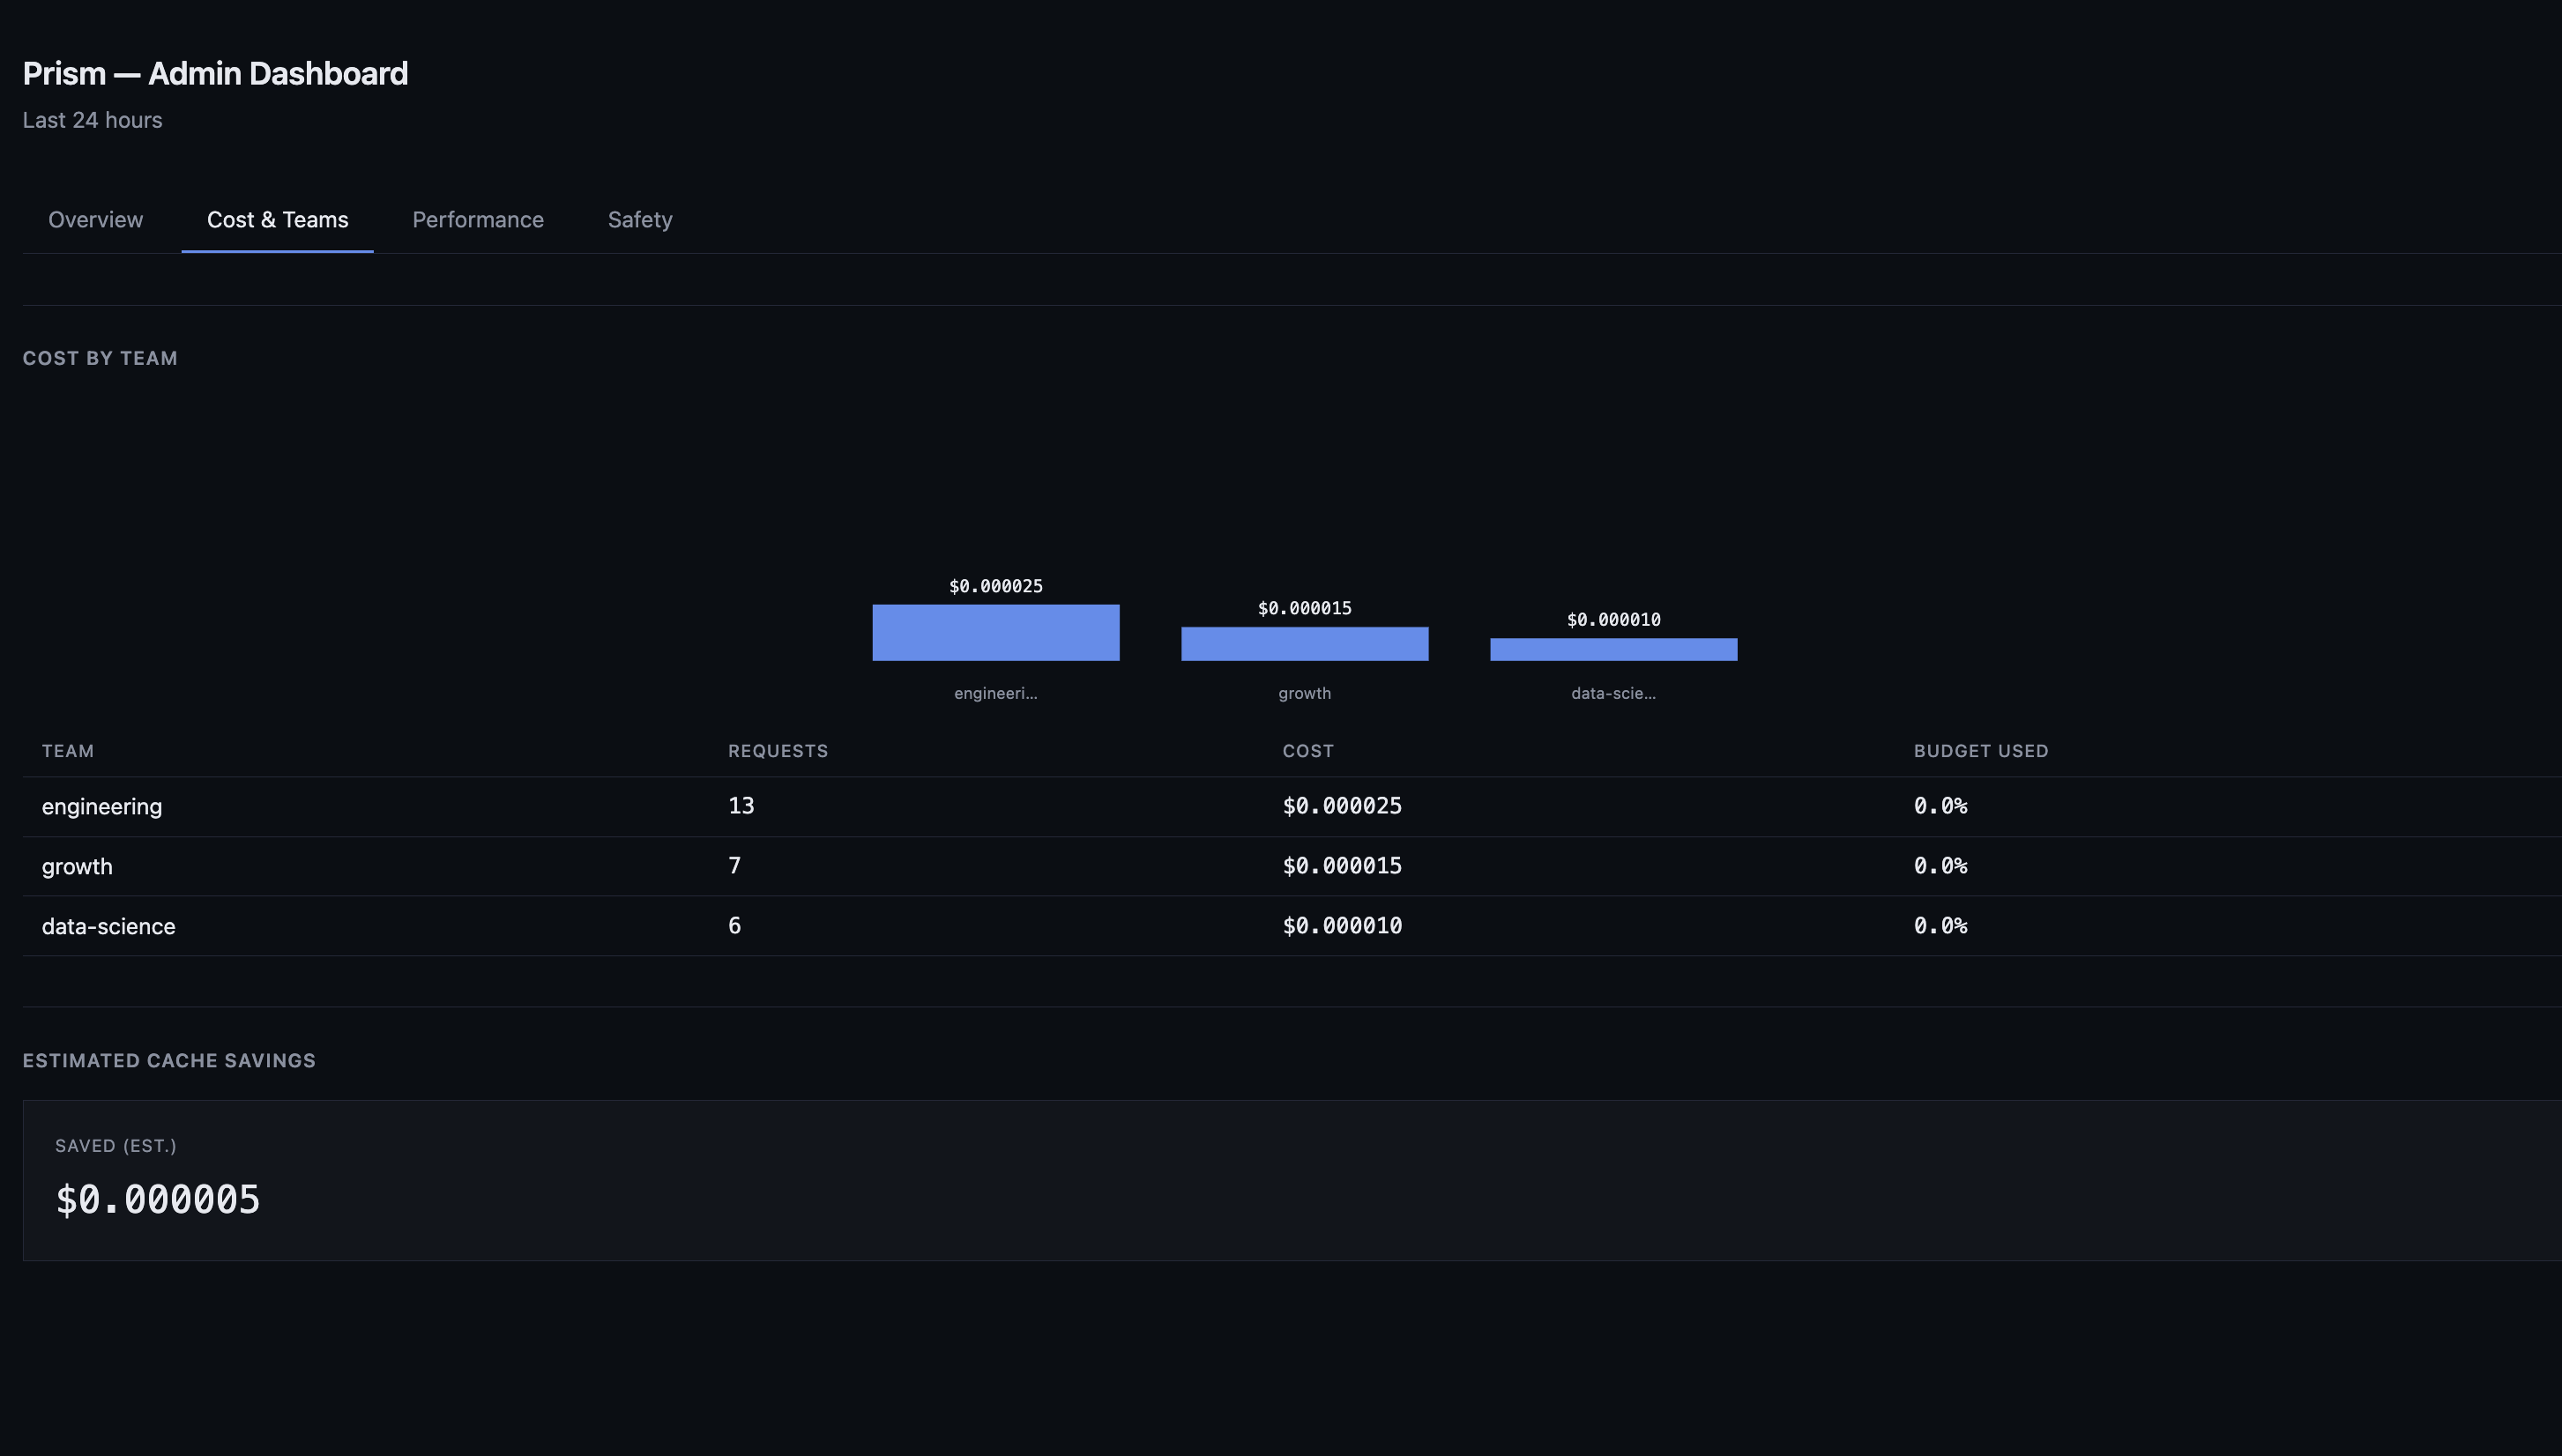
FIG. 4 — Cost & Teams
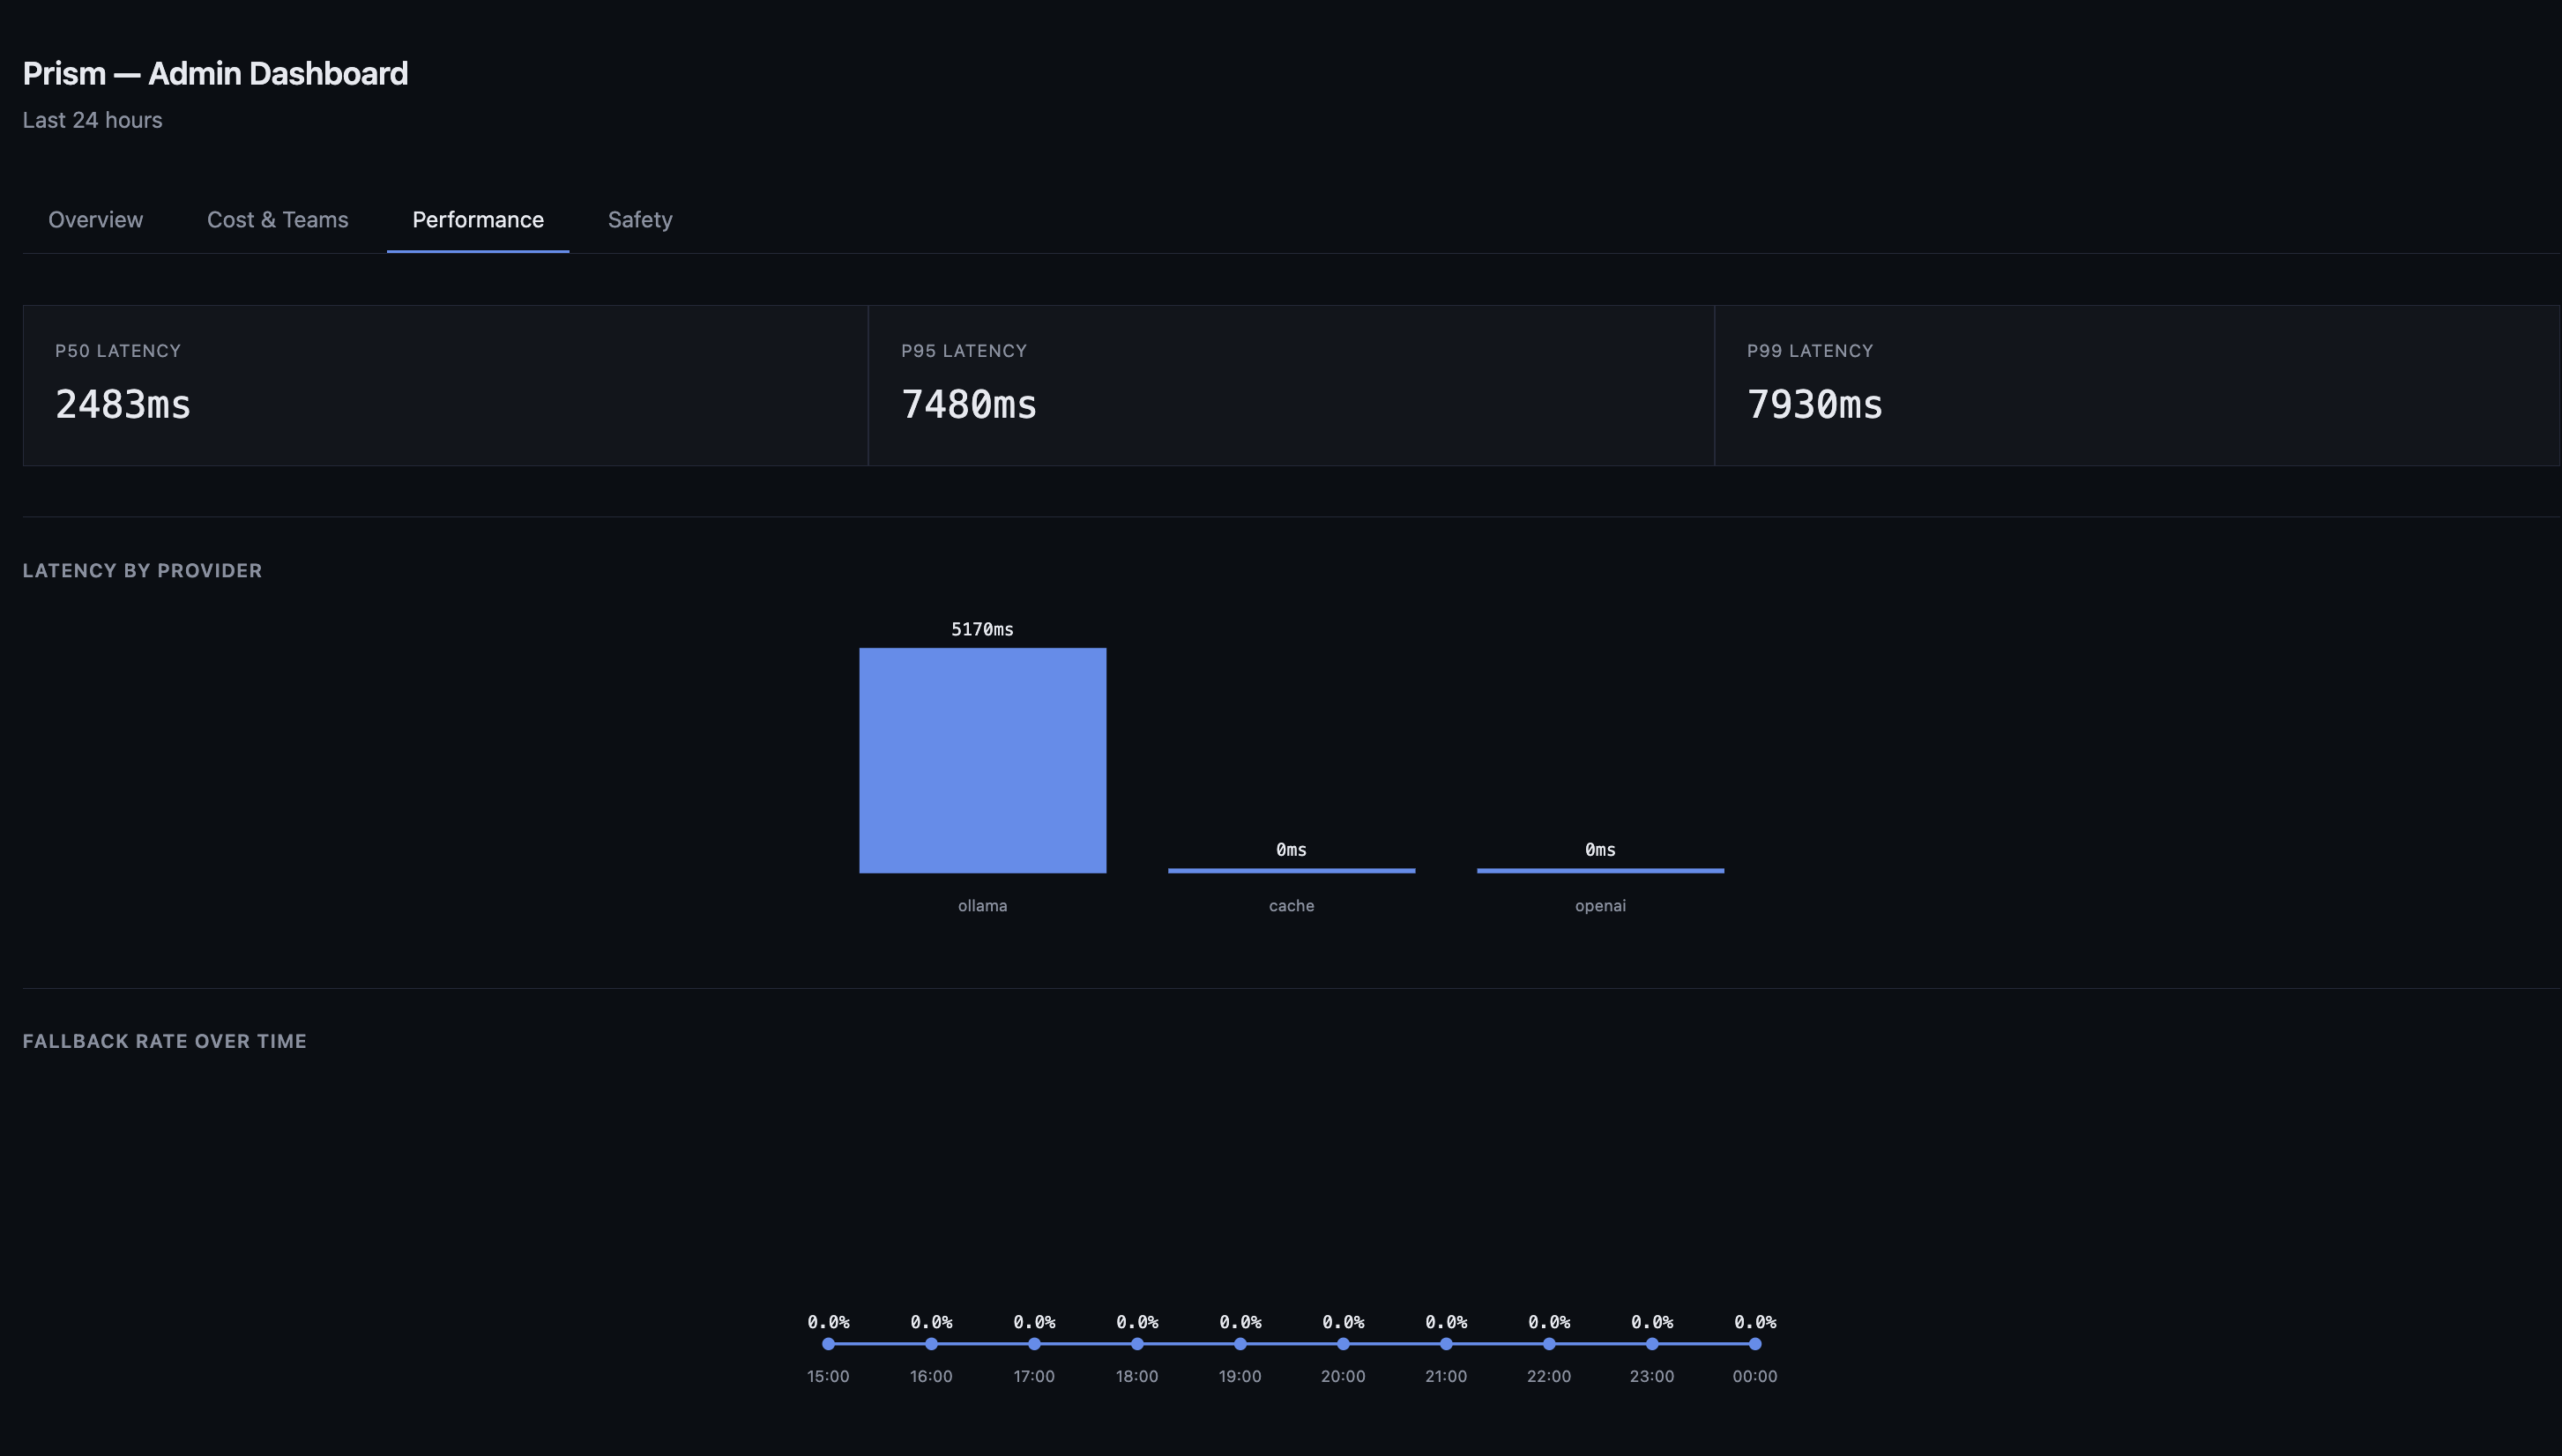
FIG. 5 — Performance
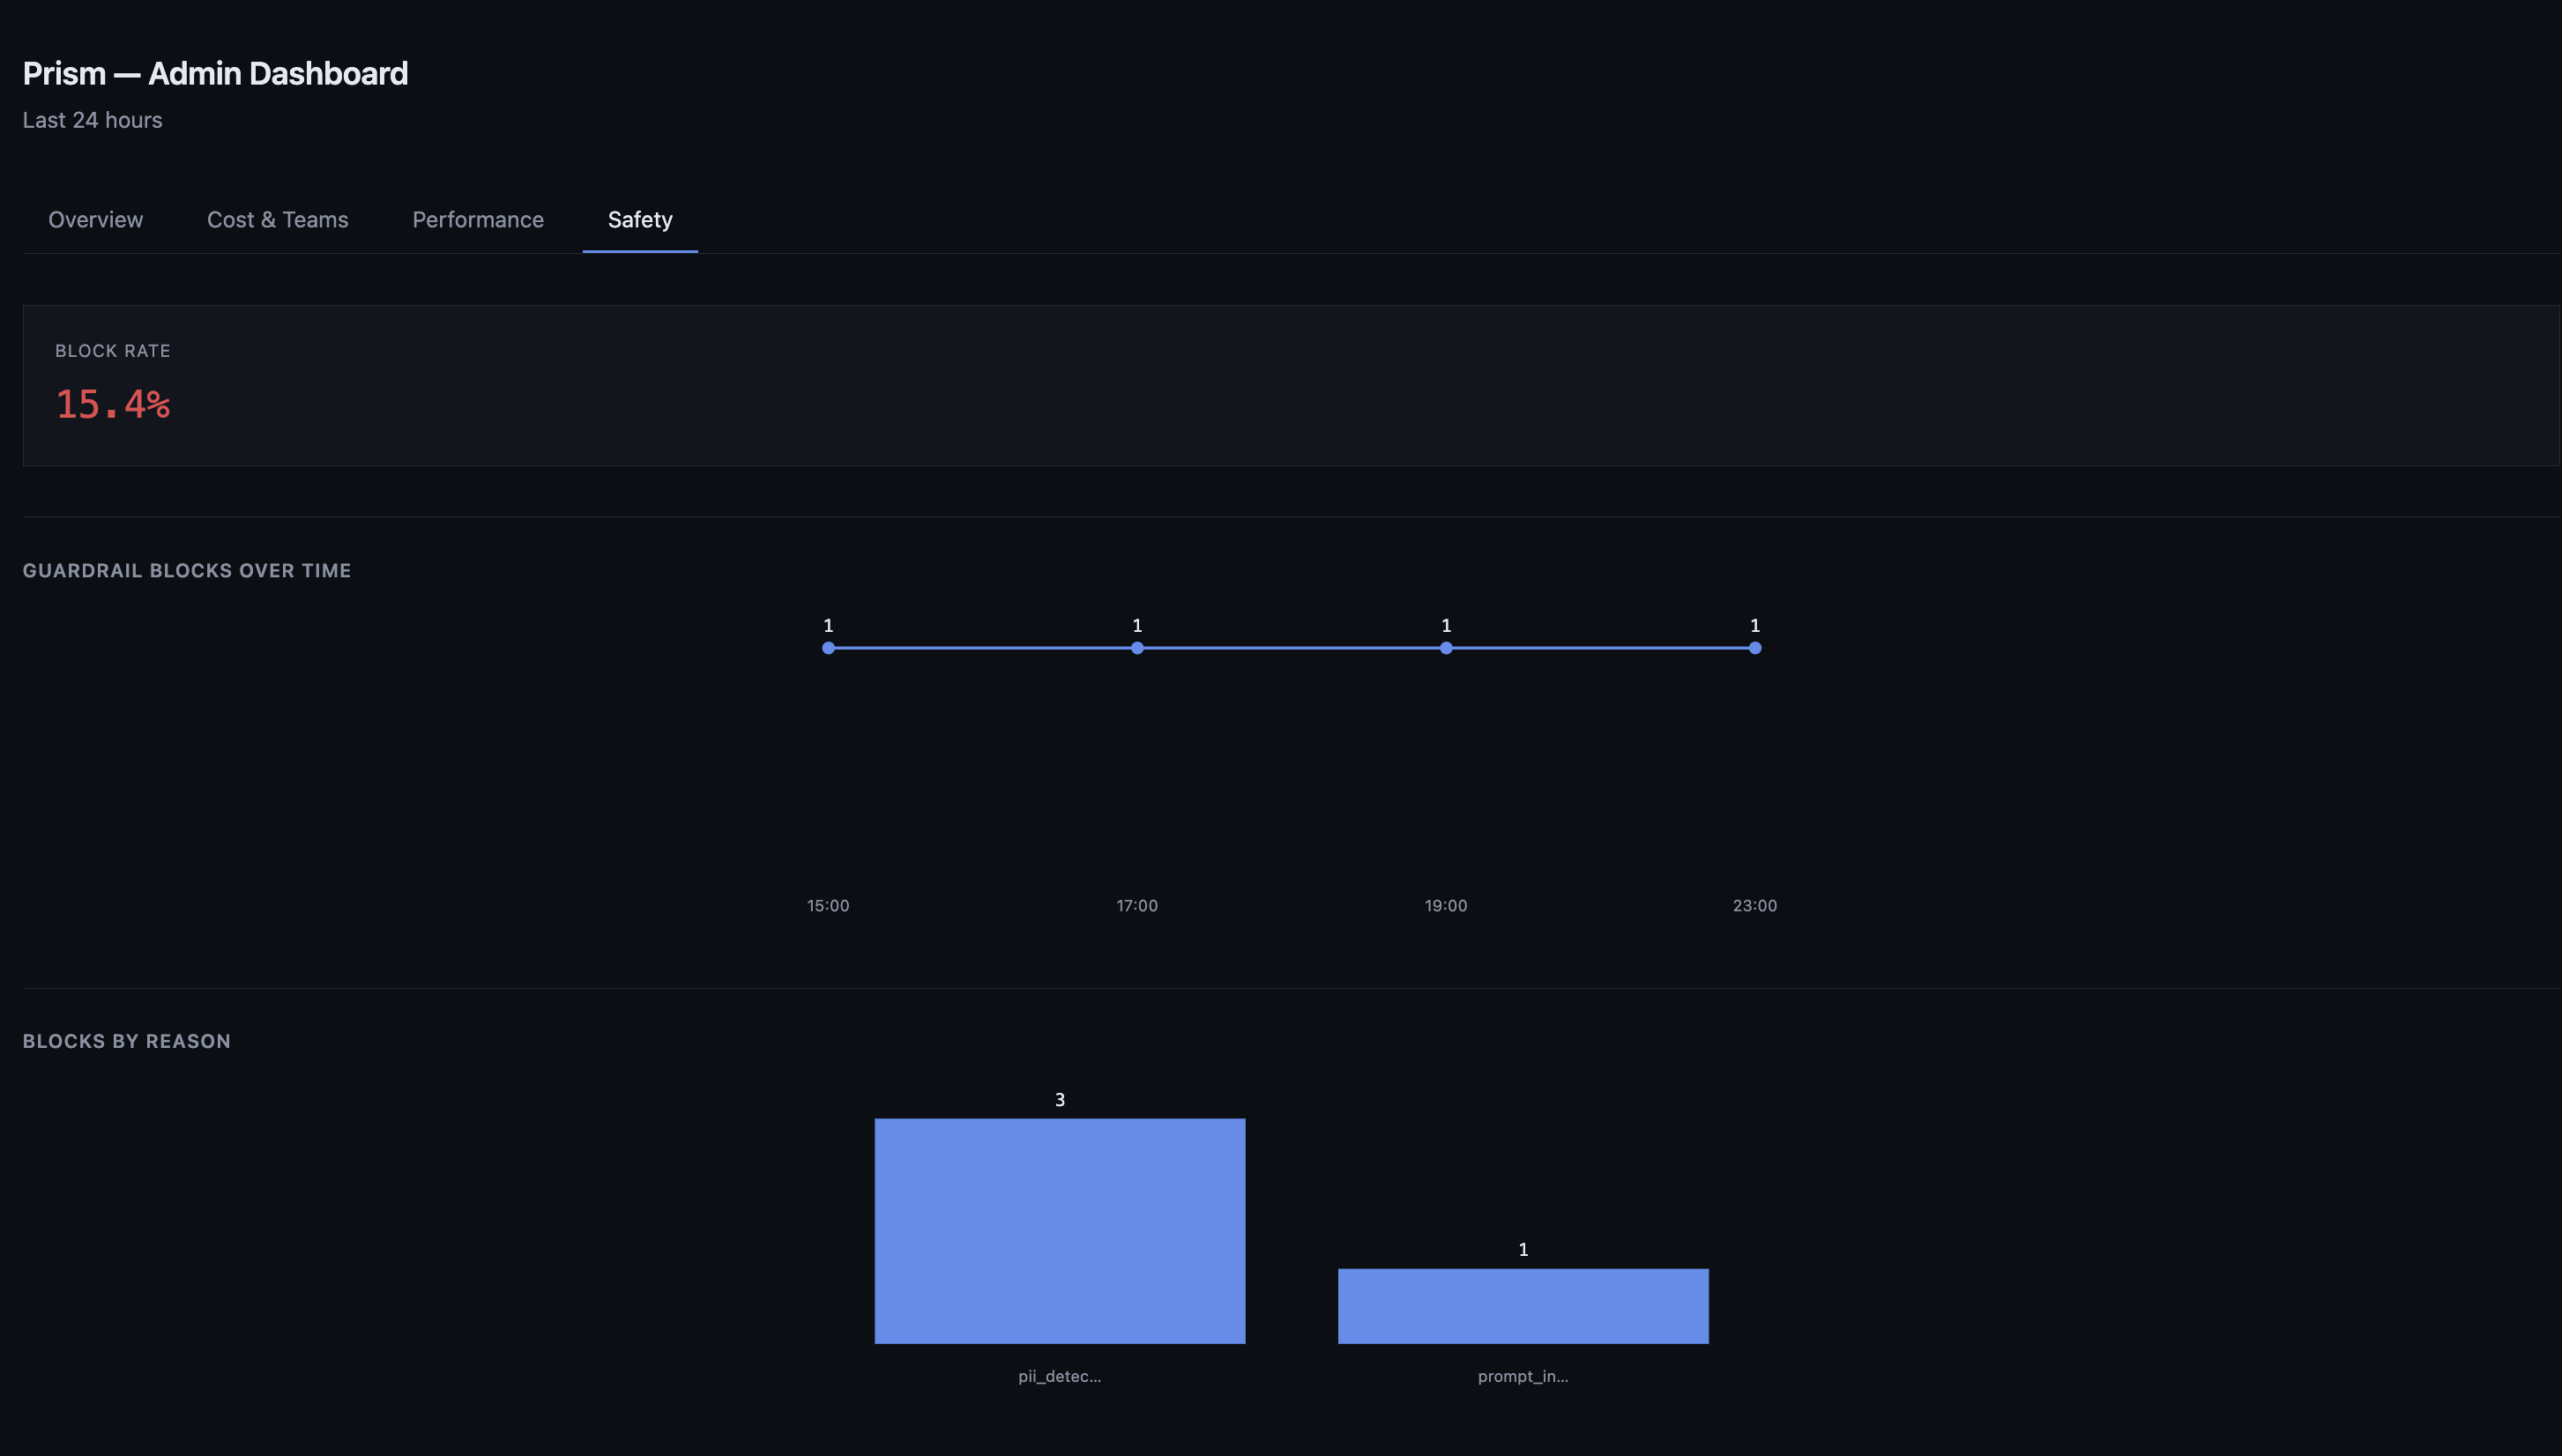
FIG. 6 — Safety
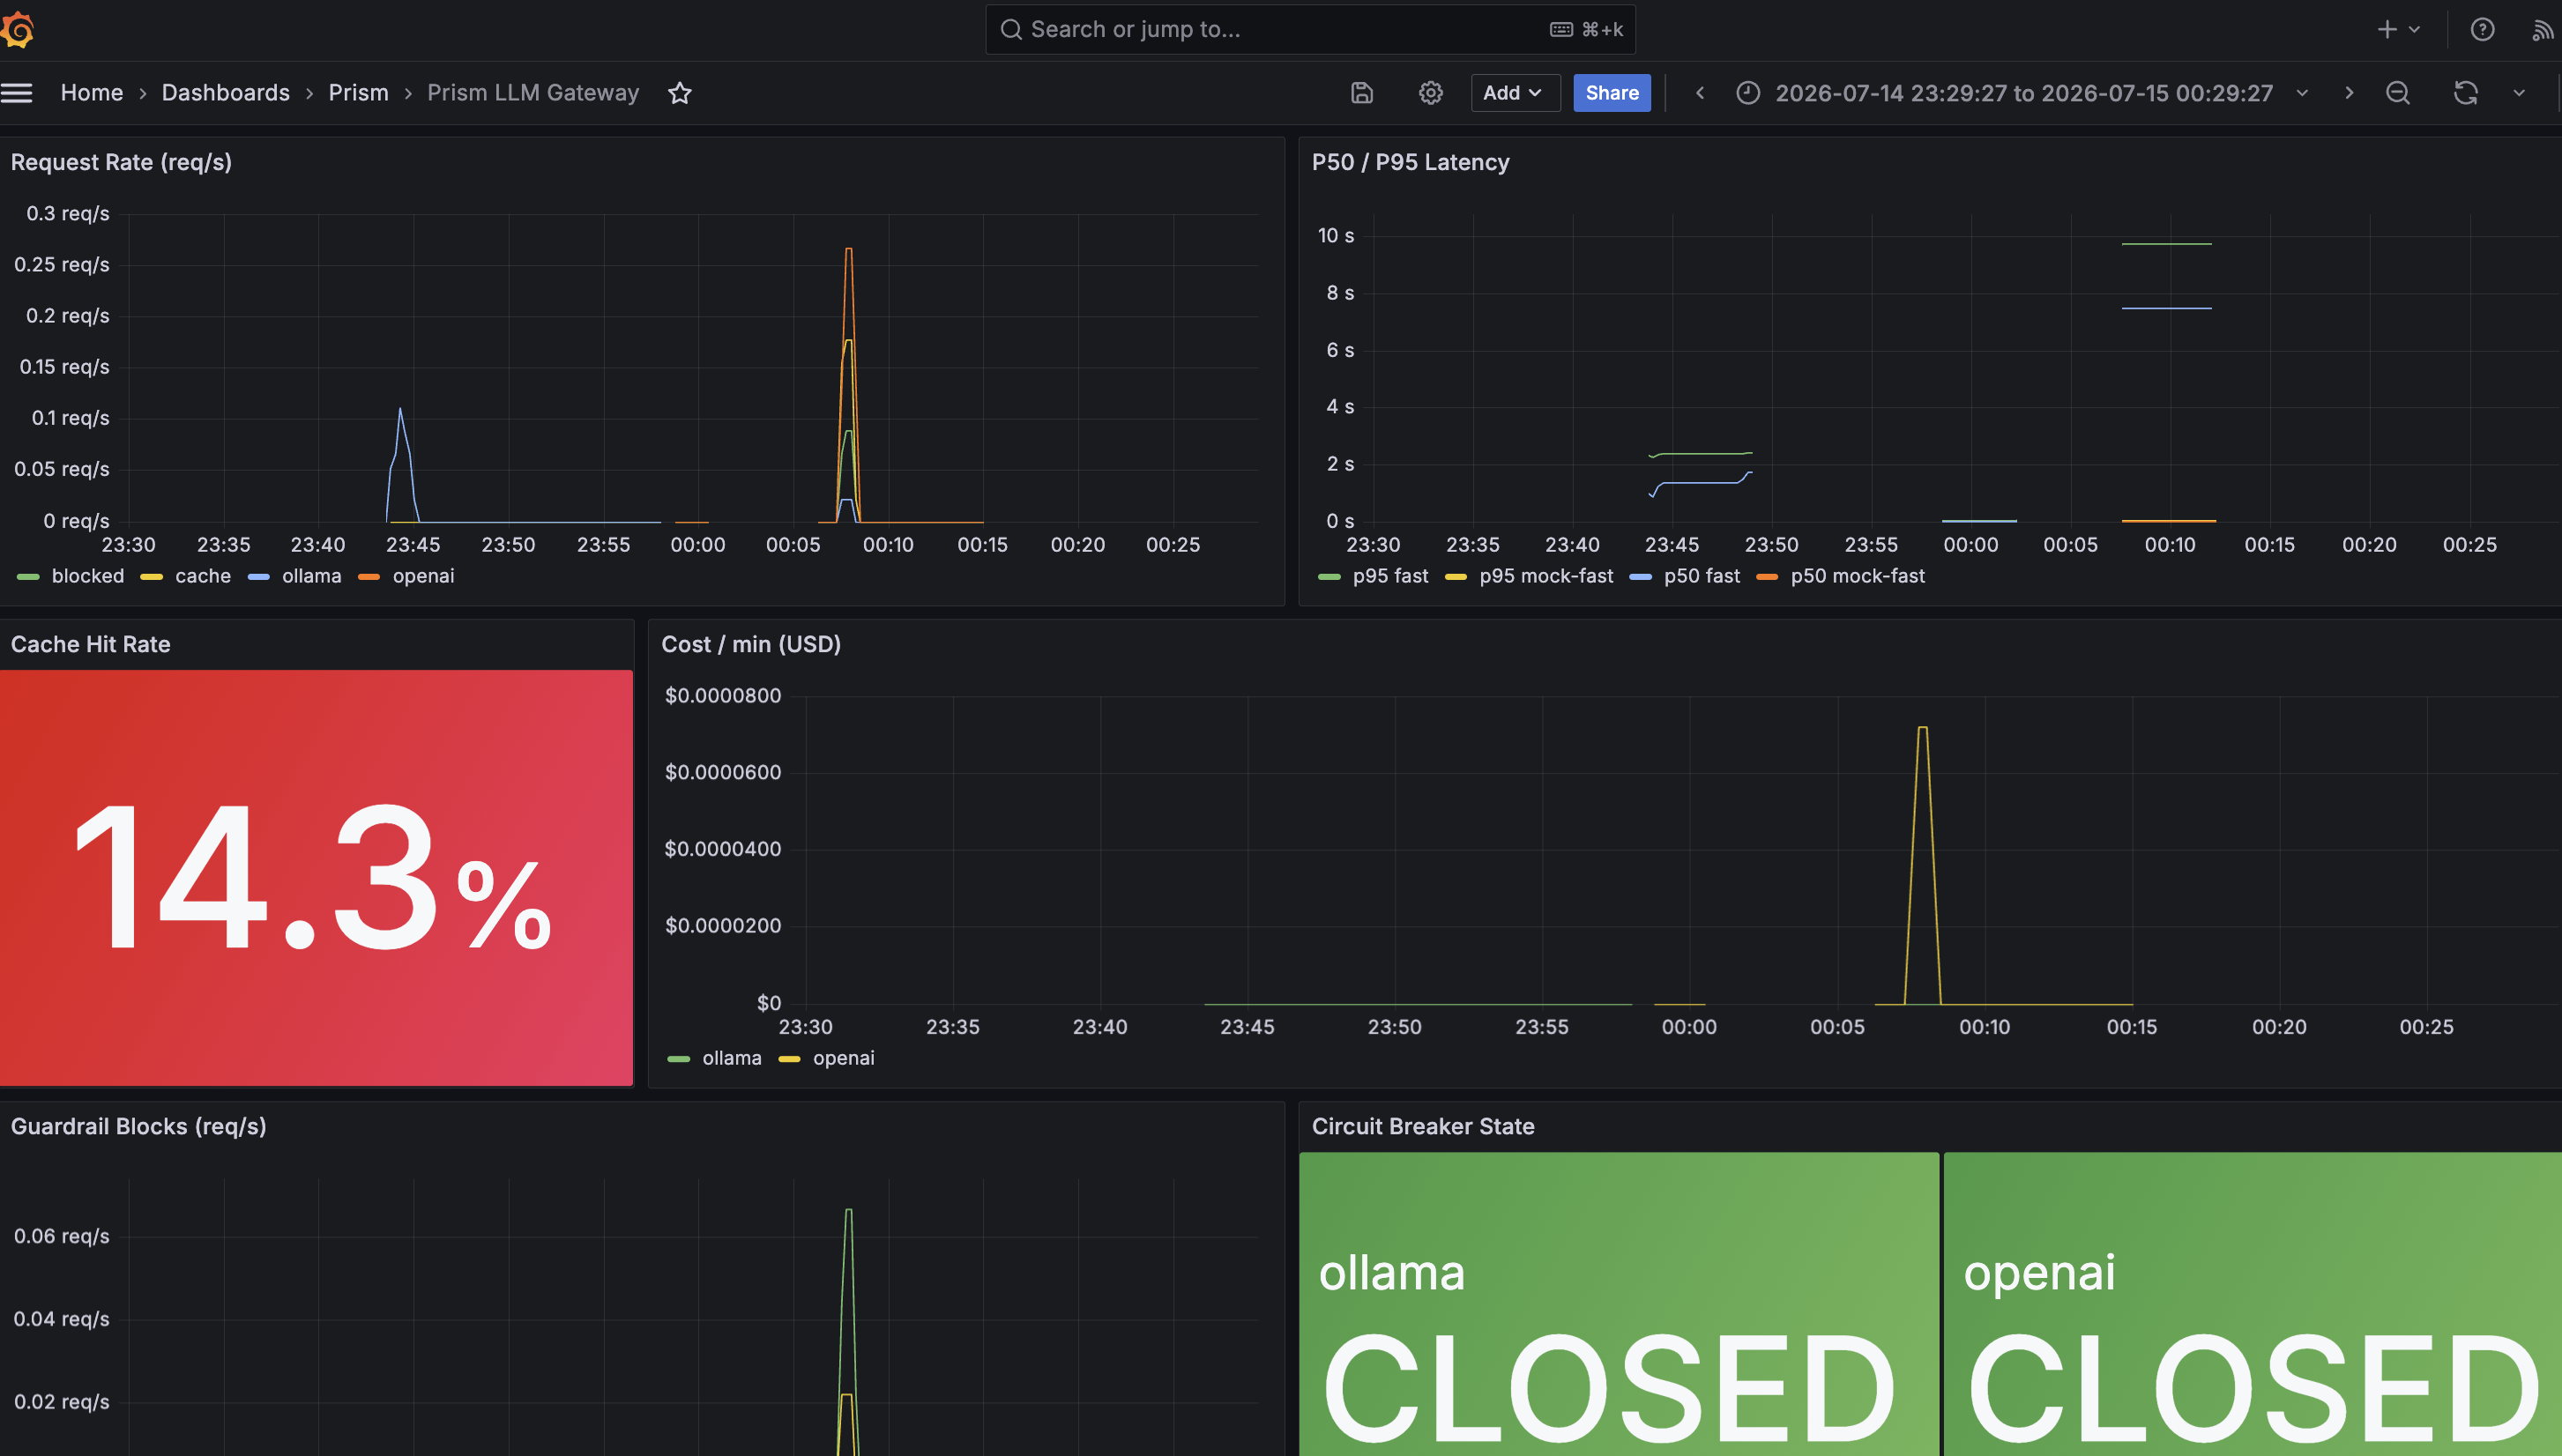
FIG. 7 — Grafana operational dashboard
Load-tested, not estimated
From a Locust load test (src/tests/load/) — see the repo for the exact run procedure. Machine: M4 Pro, single uvicorn process, no distributed workers.
Real Ollama inference averaged 595ms (p95 1134ms) vs. the mock providers' 12.6ms and the exact cache's 7.9ms — the actual gateway-overhead-vs-provider-latency isolation these numbers are built to show.
Tradeoffs made explicit, not hidden
| Decision | Choice | Why |
|---|---|---|
| Deployment | Docker Compose, local only | Cloud (EKS/Terraform) deliberately scoped out — fast local loop mattered more for this project's goals than a teardown-able cloud environment would have added. |
| Self-hosted model | Ollama, not vLLM | No GPU needed; runs via Metal on Apple Silicon with an OpenAI-compatible API out of the box. |
| Vector store | pgvector, not wired in | Semantic cache is implemented but not called from the live request path — only exact-match caching is live today, stated plainly rather than discovered later. |
| Circuit breaker | Hand-rolled state machine | Built from scratch deliberately to demonstrate understanding of the pattern, not just import it. Standard libraries everywhere else. |
| Injection detection | Regex/heuristic scorer | Honest about its limits, fast, no added inference cost. Named "v1" with a clear upgrade path. |
| Admin UI | Hand-rolled dashboard, not Streamlit | Four tabs, real aggregation queries, hand-rolled SVG charts — doubles as a demonstration of frontend fundamentals without a framework or build step. |